Published by Jeremy. Last Updated on August 11, 2026.
Disclaimer: This Week in Blogging uses demographic data, email opt-ins, and affiliate links to operate this site. Please review our Terms and Conditions and Privacy Policy. To see more of our content, set us as a Preferred Source in Google.
After switching my local blog from Mediavine to Raptive in late 2025, I have had a bit of an unhealthy obsession tracking my year-over-year performance in RPMs to figure out if one network performed better than the other. (I have the full data on Mediavine vs Raptive so far here.)
But around March of 2026, something interesting happened- my RPMs cratered from YoY increases of +40-50% to YoY decreases of about 5%.
That is a massive swing which, on the surface, could have some strong implications on network-to-network performance.
But after doing a deep dive into my ad analytics and talking to Raptive directly, we found an interesting setting change that was the most likely culprit here- we switched from WP Rocket to Perfmatters for caching. In doing so, we stopped deferring Google Analytics from loading, and the new setup started tracking a lot of short pageviews that previously were not counted, and our RPM calculation changed dramatically. (Raptive has an article on this, too, and our experience syncs up pretty well.)
It turns out, it likely had little to do with network-to-network performance at all, and was primarily due to a tracking change!
So in this one, we thought we’d break down what we saw, how we figured this one out (assuming this theory is correct, of course), and share a bit about why all of this is important only really if you engage in benchmarking.
RPM is Just a Calculation of Data – Is It Accurate?
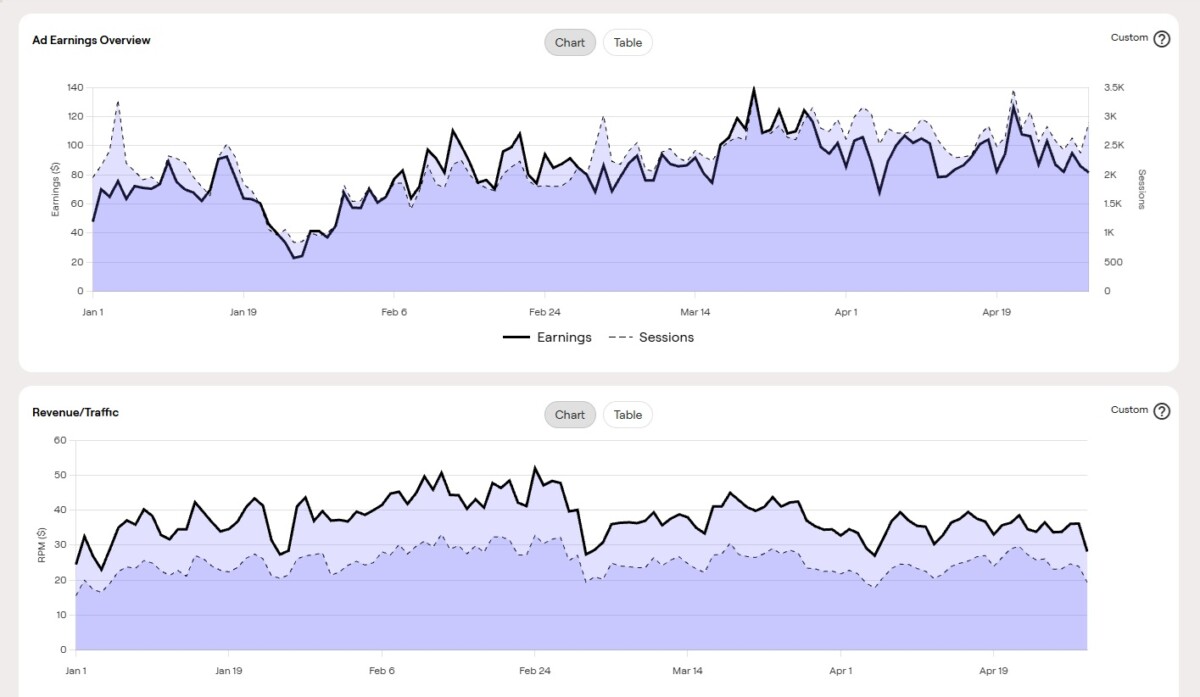
Before diving in, I wanted to make an upfront note about a specific quirk in display ad reporting that you may not have thought about before. To put it simply, RPM is just a calculation of earnings divided by logged sessions or page views.
Every page on your site with ads shows variable amounts of ad blocks, depending on article length, page setup, etc. Each one of these pages earns revenue through an array of factors like demographics, topic, whether the user is authenticated or not, etc. That revenue is then totaled for your daily/weekly/monthly gross income.
This is all absolute– money comes in from individual ads that are viewed, for whatever value each ad block is bid on for. How much money you can potentially earn is highly variable, but the money you receive is an absolute figure from ads that are viewed. We can change the max number of ads displayed, targeting “better” users for higher ad rates (i.e., readers from countries with higher ad spend), and work on other viewability issues, but at the end of the day, revenue is money earned on ads that are displayed.
Got it? Good.
Further reporting of that data, however, such as the RPM figure, which shows revenue-per-mille (thousand views), is simply a calculation that takes your gross income (absolute earnings noted above) and divides it by your reported total sessions/pageviews (multiplied by 1,000). So if you made $2,500 on 100,000 sessions, your RPM on a session basis would be calculated as $2,500 / 100,000 * 1,000 = $25 RPM.
The gross income comes from your ad network, as they receive the money from ad partners. The total sessions/pageviews figure typically comes from your analytics software, such as Google Analytics. RPM is a direct calculation that attempts to relate the two to showcase the overall earnings potential of your site.
So what happens if you suddenly see a change in RPM that was unexpected (i.e., outside of seasonal variation, start of new quarters, a traffic spike, etc.)? Did your actual total ads viewed change (e.g., a display problem)? Were there spending shifts across the entire market (e.g., a recession or local factors)? Did your ad network suddenly go to crap? Or, perhaps, did your Google Analytics reporting change?
Any of these could happen!
Okay, fine, ad networks typically don’t just suddenly go to crap overnight. But we have seen many knee-jerk reactions online that are effectively “my RPM dropped, what’s wrong with the ad network?” that could often be quite unfounded- so much so that it is one of the major reasons I am writing this article to begin with. I could have easily thrown my hands up, blamed Raptive, and been done with it- but I likely would’ve been wrong.
Since many of these possible issues can easily be sanity-checked via an email to your ad network, in this one, I’m going to dive more into an issue we found with Google Analytics after doing just that- particularly in tandem with my caching plugins WP Rocket/Perfmatters. A changed setting when I switched plugins caused a major change in how my RPM was reported!
- Note: It is worth reiterating that earnings, again, are absolute. My total earnings never changed dramatically during this event- only my reported RPM changed, and that is an important distinction.
My Problem – Analytics Wasn’t Capturing All My Traffic
A major problem with RPM calculations is that they typically rely on your reported traffic, and your reported traffic is only as good as your analytics software tallies it.
Google Analytics, for all its faults, is actually pretty good at monitoring traffic and bringing in data for our sites when installed correctly.
The trouble comes in if you use different software, which may report different figures than GA (e.g., I used StatCounter when I first started blogging as a secondary analytics service, which was wildly different), or if you have a 3rd party tool, like a caching plugin, that influences how Google Analytics operates on your site to begin with. These can result in different traffic figures being reported despite site performance (and total, absolute number of ads viewed) staying unchanged. These could result in an apples-to-oranges-style comparison because the input data may be different.
So let’s dive into the issue that my site faced to illustrate this somewhat confusing concept better.
A common situation that bloggers may run into here is whether or not you have Google Analytics delayed/deferred in loading in a caching plugin, like WP Rocket. For years, we delayed almost all 3rd party scripts on our site from loading because every extra script is an extra moment of load that could potentially interrupt full rendering of a page.
I can’t say with confidence if Google Analytics has an influence on site speed here, mind you, but I just defaulted to delaying everything to have the fastest user experience all the same. Whether my data was being reported accurately or not was never a question, if only because my data was consistent from month-to-month, year-to-year. I only really cared about relative traffic overall, so if it was off, at least it was consistently off such that elements I cared about still worked just fine (e.g., year-over-year performance changes).
When I switched to a new caching plugin, Perfmatters, my settings changed to not delay loading of Google Analytics, and this directly resulted in the issue I have been alluding to thus far in this article- my reported traffic changed (namely, I started capturing more short page loads that were otherwise missed when the script was delayed). Since RPM is simply a calculation that utilizes traffic data as discussed above, my RPM changed as well with a sharp decline- the new setup was catching short pageviews that otherwise were excluded.
On one hand, this is not really that big of an issue- RPM is just a calculation, after all. My absolute earnings didn’t change, which is what most of us care about at the end of the day anyway.
But for someone like me who is data-minded, the minute you change traffic reporting (and thus, RPM calculations), the minute you start to lose some ability to do long-term data analysis- like month-over-month or year-over-year monitoring of trends. So my monitoring of year-over-year RPM changes after switching ad networks became a whole lot more complicated.
Bloggers are often quick to take changes like these and point to the ad network, such as “why is Raptive no longer earning as much as it used to!” and, in this particular case at least, the answer had nothing to do with the ad network and seemingly everything to do with my analytics!
The Dirty Details on Why My Reporting Changed
Let’s get a little bit nerdy to dive down into what exactly happened here and how I caught it, because I find this analysis to be rather interesting as a data-minded blogger.
After a few months of seeing suppressed RPMs on Raptive (which I identified because I went from having RPMs being up ~40-50% YoY to suddenly being down about 5% YoY), I sent my ad rep a message and asked if something was wrong with my ads (checking to see if it was a network problem displaying all ad blocks and influencing my absolute earnings).
After some insights, they said ads were displaying just fine and pointed to me switching from WP Rocket (with delayed GA loading) to Perfmatters (without delayed GA loading) as the likely culprit- and even pointed to the specific date that I made this change (which was correct).
As mentioned above, I went from not including short page loads being captured in GA to suddenly including them. My earnings from these ads were still always tracked and included in my payouts, as earnings are absolute, but the impact on the RPM calculation now had more traffic influencing the output.
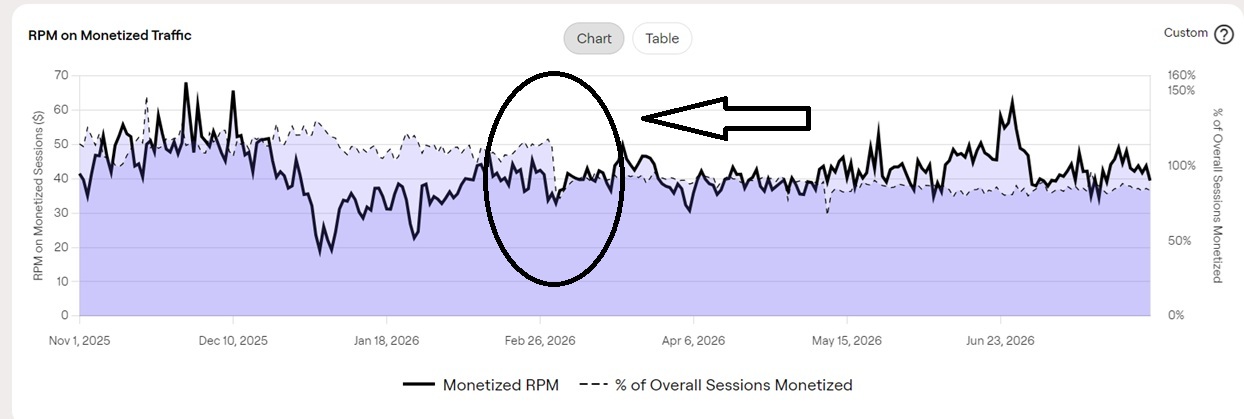
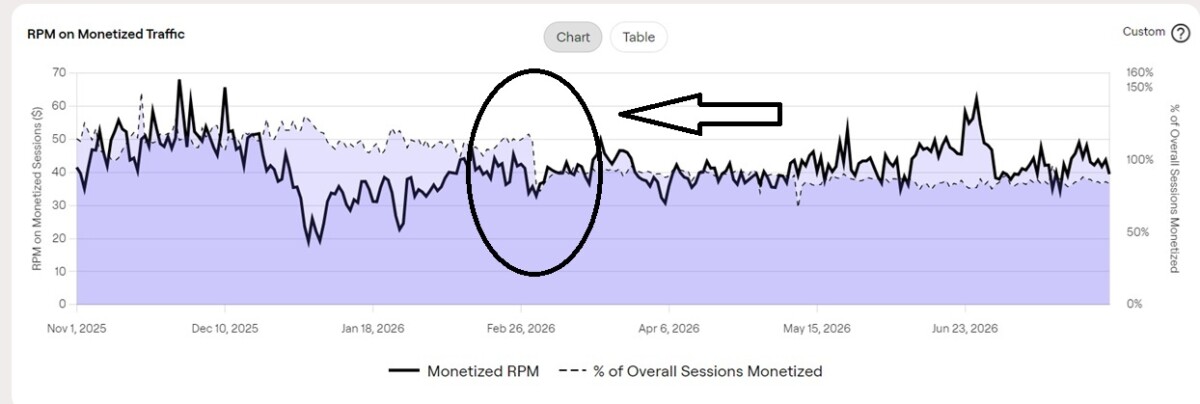
I spent nearly an entire day doing data analysis to try and pinpoint this even further, and I only found one graph within Raptive’s analytics dashboard that showed this discrepancy directly. This one was under Earnings -> Overview -> RPM on Monetized Traffic.
On this chart, I could see, with absolute clarity, the day my reporting changed, as illustrated in the above screenshot.
Prior to switching, my % of Overall Sessions Monetized almost always showed a figure above 100%, such as 110-120%. If you stop and think about this a moment, the only way this one makes sense to be > 100% is if there is non-reported traffic showing ads. This, to me, suggests that Google Analytics was not tracking all of my traffic, and my reported sessions could have been low by at least 10-20%.
- Note: I am not sure if other ad networks, like Mediavine, have a chart displaying a “sessions monetized” metric the way Raptive does. I do not recall seeing one in my dashboards on other networks. You may have to contact an account rep to see if this is data they track if it is not publicly available. If you have something like this available on a different network, please comment on this article to let us know.
The day I switched to not deferring Google Analytics from loading, two things happened.
First, my traffic jumped about 20-30% practically overnight. I had originally written this off as being seasonal- I switched at the start of March when my local blog’s traffic normally starts seeing an upswing anyway, so a sudden spike in traffic was easily overlooked.
My revenue, on the other hand, remained flat, and my RPMs decreased accordingly because it is just a calculation at the end of the day. It would’ve been very easy for me to write this off as an “it is what it is” thing because the calculations still worked.
Second, my % of Overall Sessions Monetized chart immediately dropped from 110-120% to 80-90%. Only in seeing this chart did I start connecting the dots, as our monetized session drop was almost too perfectly proportional to the change in our RPMs.
Going from 110-120% monetized sessions to 80-90% monetized sessions is, naturally, a roughly 20-30% swing downward- dare I say a near-perfect reflection of my reported traffic and RPM changes. In theory, this one should not change with a sudden traffic spike unless you’re in the middle of a viral pop with a lot of bouncing traffic or exhausting premium ad buyers for a short duration. So a long-term, consistent change was pointing to something else going on entirely.
This is where it all came together for me- Google Analytics simply had a change in input data, and that is likely all there is to it.
To finish, it is worth reiterating that this may not actually mean that much overall unless two specific cases exist for you:
- If you are comparing your RPM performance over time, your traffic benchmark has now likely changed. So that MoM or YoY RPM figure could end up being quite misleading (I was here).
- If you are comparing your blog’s RPM performance to that of another blogger with a similar ad setup, you may be looking at an apples-to-oranges comparison here for similar reasons. Is one blogger earning $35 RPM on Raptive and a virtually identical blogger earning $45 RPM on Mediavine an indication that Mediavine is a better-paying ad network (or vice versa), or could we be benchmarking two different traffic cases without realizing it? Both could be true! (If you are following our Mediavine vs Raptive RPMs to see how my performance is going and comparing to your own situation, you are here.)
My problem was that I was tracking my year-over-year performance to see if Raptive behaved better than Mediavine after I changed networks. Until I switched caching plugins, Raptive seemed to be doing much better. After I switched, my reporting changed and made me think it was not. It likely still was, at least in absolute income terms, and it was likely just a reporting change all along!
While this one definitely gets into the minutiae of a very specific issue in data reporting (and, to be honest, I may still be wrong on something outright, too), if you are seeing a sudden swing in RPM calculation and have recently changed your caching plugin setup, this could be one explanation. It was for me, and I have to guess I am not alone here.
Have you changed caching plugins and seemed a similar RPM change? We’d love to hear about it. Comment below to share!
Join This Week in Blogging Today
Join This Week in Blogging to receive our newsletter with blogging news, expert tips and advice, product reviews, giveaways, and more. New editions each Tuesday!
Can't wait til Tuesday? Check out our Latest Edition here!

Upgrade Your Blog to Improve Performance



Check out more of our favorite blogging products and services we use to run our sites at the previous link!
How to Build a Better Blog
Looking for advice on how to improve your blog? We've got a number of articles around site optimization, SEO, and more that you may find valuable. Check out some of the following!