Published by Jeremy. Last Updated on June 14, 2020.
Disclaimer: This Week in Blogging uses demographic data, email opt-ins, and affiliate links to operate this site. Please review our Terms and Conditions and Privacy Policy.
One of our favorite services to look at our blog's site speed is WebPageTest. This free service provides a wealth of data about your site and really lets you dive down into the individual components that make your blog tick.
In running a test, we know that the amount of data returned in this one can cause information overload. To help, we put together this guide featuring some of the most important elements we look at when optimizing our blogs, what they mean, and potential fixes that you can implement on your own blog for speed improvement!
Note: All website owners can run a test on WebPageTest and analyze results, but some of our recommendations below are targeted purely towards WordPress users.
How We Run WebPageTest
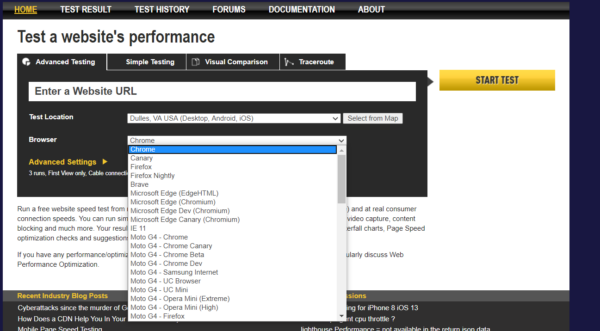
Setting up a test in WebPageTest is fairly easy. You enter the hyperlink for any website you want to evaluate and then select a test location and browser type that you'd want to run on. While you can get creative and run tests in various locations around the world and on all manner of browsers (including mobile options), we tend to pick the testing location closest to us and Chrome for simplicity.
Once these fields are populated, there are some advanced settings you can change to enable and disable specific settings (like javascript), but for most bloggers the default test should be sufficient for a first pass.
Click ‘Start Test' and off you go!
- Note: We recommend performing tests on your homepage and on individual articles. Static pages such as a homepage may have different load considerations than blog posts.
Check Your Overall Ratings

The default settings in WebPageTest should run three tests on your blog (this can be changed to run up to 9) and returns the median test results in the header area for quick analysis.
The first section you should look at is the color-coded letter scores (A-F) in the top right of your results. This should give you a quick indication of aspects of your site you may want to dive down into more. Generally speaking, green and a score of A or B are good and anything else likely warrants improvement. The “Effective Use of a CDN” box is unique here as it only shows an X or a Check Mark based on if you use a CDN. If you get an X, you may want to talk to your host about installing Cloudflare or an equivalent service.

If you click the letter score, you will be taken to a separate page that itemizes the components that go into the score. While there may not be easy fixes for a number of them, you may find some ideas on what troublesome areas exist.
From there, we drop down into the performance results table to look at our data further.
- Note: Security Score may be the only score you are unable to improve upon for your website (if running on WordPress at least). One known problem with WordPress is that it uses an old version of jQuery in order to be compatible with all the open-source themes and plugins out there. This often contributes to poor security scores on many sites.
Analyze the Returned Data Table

The Performance Results data table has a lot of information you could consider when optimizing your site. However, a few of the most important ones to us are the following:
- First Byte (also known as Time to First Byte, TTFB): The time it takes for the request to send the first bit of data back from your server.
- First Content Paintful: The time it takes your website to go from a white screen to displaying the first piece of content.
- Document Complete Time: The time it takes all the static components of your site to be loaded.
- Fully Loaded Bytes In: The file size of your website when it is fully loaded.
In all my reviews of fellow blogger's sites, one of the biggest culprits to poor load time is often your First Byte time (server response time). I generally like to attribute this to the host you have more than anything; however, some blog settings around caching and even your CDN choice may influence this too.
In the above example, a friend of mine was running her site on a budget server that will remain nameless. Her overall load times were great, but she wanted to be faster and couldn't figure out the problem. One quick look and I noticed her First Byte time was 1.5-2+ seconds (depending on the run) and I theorized her server was to blame (upon confirming the host, I was fairly certain of it). Premium servers, like ours on BigScoots, often load in about 0.25-0.3 seconds when testing on Chrome in the USA whereas budget servers can be as much as 10x slower.
She switched and immediately saw an improvement on day one. She could've tried a CDN first, but in this particular instance I suspect that upgrading was the right choice.
Your First Content Paintful is the time it takes a user to feel like your site is loading with content starting to display on the screen. Things may still be loading in the background, but generally speaking this is the point where the white space is replaced with the first piece of visible content. If you have a huge delay between this and your First Byte time or between this and Document Complete time (say, > 1 second for either), you'll need to investigate your waterfall as something is slowing you down. In the above example, the delay here was about 0.4 seconds and 0.5 seconds respectively and suggests that the site is likely well optimized.
Document Complete Time is the time your site's static content loads in (dynamic content is represented in the fully loaded column). The general rule of thumb is to have this be under 3 seconds to prevent people from getting frustrated and bouncing from your site. If yours is significantly slower, you'll want to investigate your waterfall more.
The final item we look at is the Fully Loaded Bytes In as this is the file size of your website. A fully optimized site may end up being a few hundred kilobytes in size, but if you check yours in you are on the order of several megabytes it is a clue that you perhaps have room for improvement (most likely around images). This is important for any reader who may be looking at your site on a mobile plan where they pay on data used, but larger file sites also tend to just take longer to load so they go hand-in-hand.

After isolating some general concerns above, you can dive into your waterfall to find the culprit(s). To do so, click the image under the Waterfall header in the Test Results section to expand it. This data is displayed for every run, so you can choose to look at an average waterfall or an outlier if one exists.
Dive Into the Waterfall Head First
")
At its core, a load waterfall is a visual representation of when every single item on your site loads and how long each takes to execute. The wider the band, the longer it takes to load. It is worth noting that the time scale across the top is in seconds (in 0.5-second increments), but the individual times summarized for each band are in milliseconds (1,000 ms = 1 s).
On a first pass, you should look through the waterfall and find the widest bands and isolate which items on your site are the culprit. The hyperlink extensions on the left are cues you can look for. In our example above, the very first band is the server response time- showing 1635 ms (1.635 seconds). We saw this was a problem in the above analysis. The next item of concern is an image at the very bottom loading in 1106 ms (1.106 seconds). It is possible this could be further optimized via compression or lazy loading.
If your images are loading in > 1 second, it may be an indication that you need to run an image optimization service like Kraken or Smush, enable lazy loading with Lazy Load by WP Rocket or WP Rocket Pro, or a mix. If it is your server response time in the first band, you may want to upgrade your server. If it is a specific file ending in .js, you may want to investigate what aspect of your site is using it (likely a plugin) and figure out if you can replace it with a faster option or remove it outright. This may be trial and error depending on the script.
- Smush Pro can optimize your entire image database in a click; however, has an expensive monthly fee if you want to maintain service after your initial month/optimization. Free plugins are often limited to upload optimization only and a maximum file size (often 1 MB). We use the free version of Smush in tandem with optimizing in Lightroom prior to upload.
If you look through your waterfall and see dozens of .css and .js files, you may want to install a minimization plugin like Autoptimize in order to try and combine them all into a single file and improve your load times. It is worth noting that this could break your site if not done properly as plugins like Autoptimize sometimes do not play well with select themes or plugins. As such, we may only recommend this one for those who are on a managed WordPress host who can either adjust the settings for you or be responsive to fixing downtime errors quickly. We would not recommend testing this on budget servers.
There may even be instances in your load waterfall where you see half of your site not loading until one specific item is loaded completely. Most items can load concurrently, but some javascript files must be fully rendered before allowing the rest of your site load. If that script is also slow, this could cause a huge delay in your load times. We do not have a screenshot of this case, but it would look a lot like how the first band for server response time looks above but partway down your load waterfall. You may want to investigate what file is causing that delay as well.
While we may not be able to specifically tell you what is slowing your site down via a broad article, we hope the above explanation helps you identify a few potential issues and possible fixes to help improve your load times. By running through a few optimizations, you may be able to get your site flying like ours:

Have any questions about how to read your own load waterfall? Comment below!
Join This Week in Blogging Today
Join This Week in Blogging to receive our newsletter with blogging news, expert tips and advice, product reviews, giveaways, and more. New editions each Tuesday!
Can't wait til Tuesday? Check out our Latest Edition here!

Increase your blog's revenue with Raptive!
Add premium display advertising on your blog with Raptive- accepting blogs starting at 25,000 pageviews per month! (Additional terms may apply.)
Upgrade Your Blog to Improve Performance


Check out more of our favorite blogging products and services we use to run our sites at the previous link!
How to Build a Better Blog
Looking for advice on how to improve your blog? We've got a number of articles around site optimization, SEO, and more that you may find valuable. Check out some of the following!