Published by Jeremy. Last Updated on May 11, 2026.
Disclaimer: This post contains sponsored content. This Week in Blogging uses demographic data, email opt-ins, and affiliate links to operate this site. Please review our Terms and Conditions and Privacy Policy.
If there is a term that would describe me best, it would be data junkie. I just can't get enough of data, and analyze my accounts and performance to every last detail whenever possible.
Naturally, when it comes to affiliate sales, I want as much data as I can get to see what works for my sites.
One of my favorite travel affiliate networks, Stay22, has rolled out a wealth of analytics features on their dashboard. So in this one, we thought we'd break out what each analytics page tells you and share some tips to do a deep analysis of your own performance!
- The Stay22 hub has three areas for tracking your analytics that you may be interested in checking out. On the left sidebar, these are Bookings, Analytics, and Page Analytics. We will break down each of these in more detail in subsequent sections.
Bookings Tab on Stay22
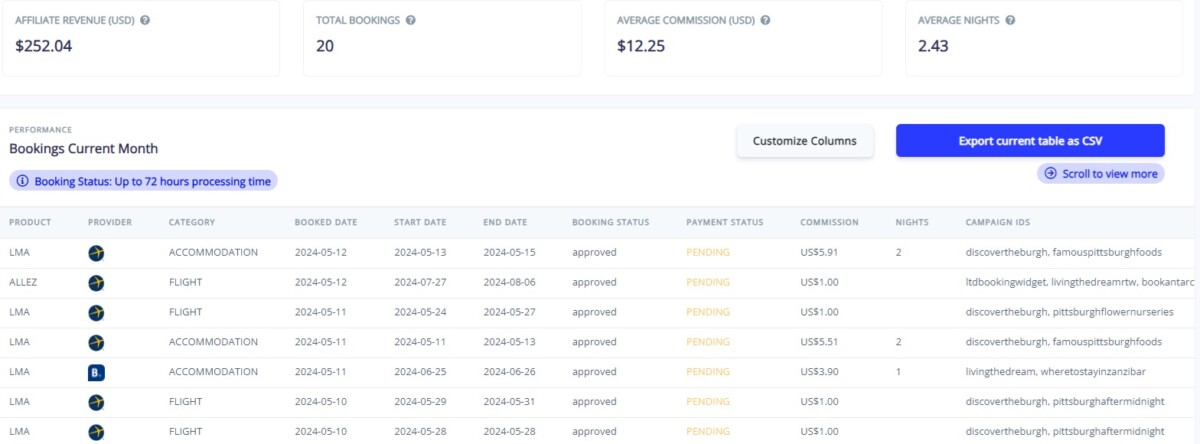
The Bookings tab is the primary workhorse of Stay22 analytics. It features snapshots of your overall performance, both in booking value and individual bookings, and a detailed breakout of every individual booking.
The latter is of the most interest to us when diagnosing performance as there is a wealth of data available here including what Stay22 product the booking was made with (e.g. Map, Allez deep links, or LMA script products), the service provider (e.g. Expedia), category (e.g. accommodation), and then more data about booking dates, country of origin for the user, properties booked, commission, and more.
One item, Campaign IDs, is interesting as it tracks the customized campaign IDs you made for each link/product, as well as an identifying ID for the URL the product was booked from (when relevant).
This data can be exported into an Excel file for more manipulation, and we particularly like to use Filters or Pivot Tables to organize bookings by Campaign ID, country of origin, provider, etc. and compare data points to see if any trends are present.
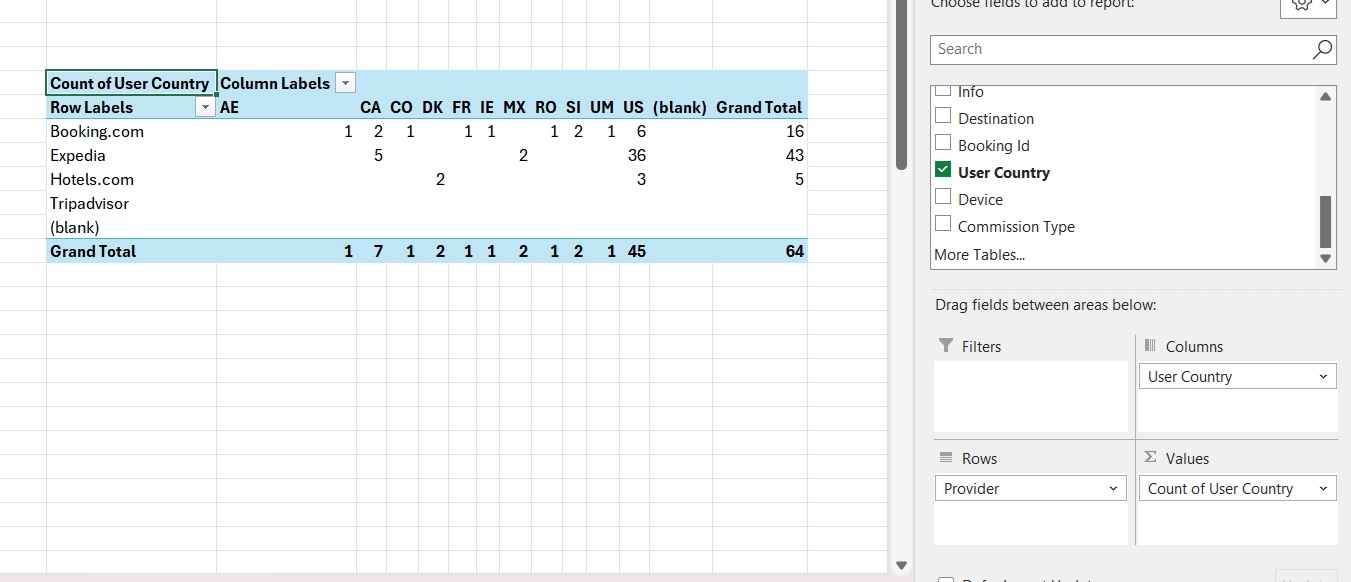
Pivot Tables have a bit of a learning curve, but within a few clicks can unlock a powerful data analysis tool. In Excel, open the Insert tab and click the Pivot Table button on the menu. A popup will appear that prompts you to select a blank cell (we pick one to the right of all the data), and then create a table.
After doing so, a box should appear that prompts you to open the Pivot Table settings to build your table. Here, you can drag the column names from your original data set and lump them together in either rows or columns, and apply different metrics like count of data, sum of data, average of data, and the like. This lets you fix one relationship, say, Provider in the rows column and count of User Country in the columns box, plus a second User Country in the Values box (set to Count of User Country). This creates a table breaking out what providers users from each country like to book so you can see if any trends are present.
I was pretty shocked to find that my bookings are heavy Expedia in North America and Booking.com in Europe! This certainly helped change how I promoted partners moving forward, as I was likely leaving money on the table promoting Booking.com to my primarily North American audience.
The sky is the limited here on analysis types you can do, but only in exporting your data can you unlock even bigger potential!
- Note: Your Stay22 account rep can also export your booking data with even more data points included, like a breakout between the Nova product within the LMA script (the current dashboard only shows LMA for all products here). If you really want to dive into your data, reach out to your rep for an export!
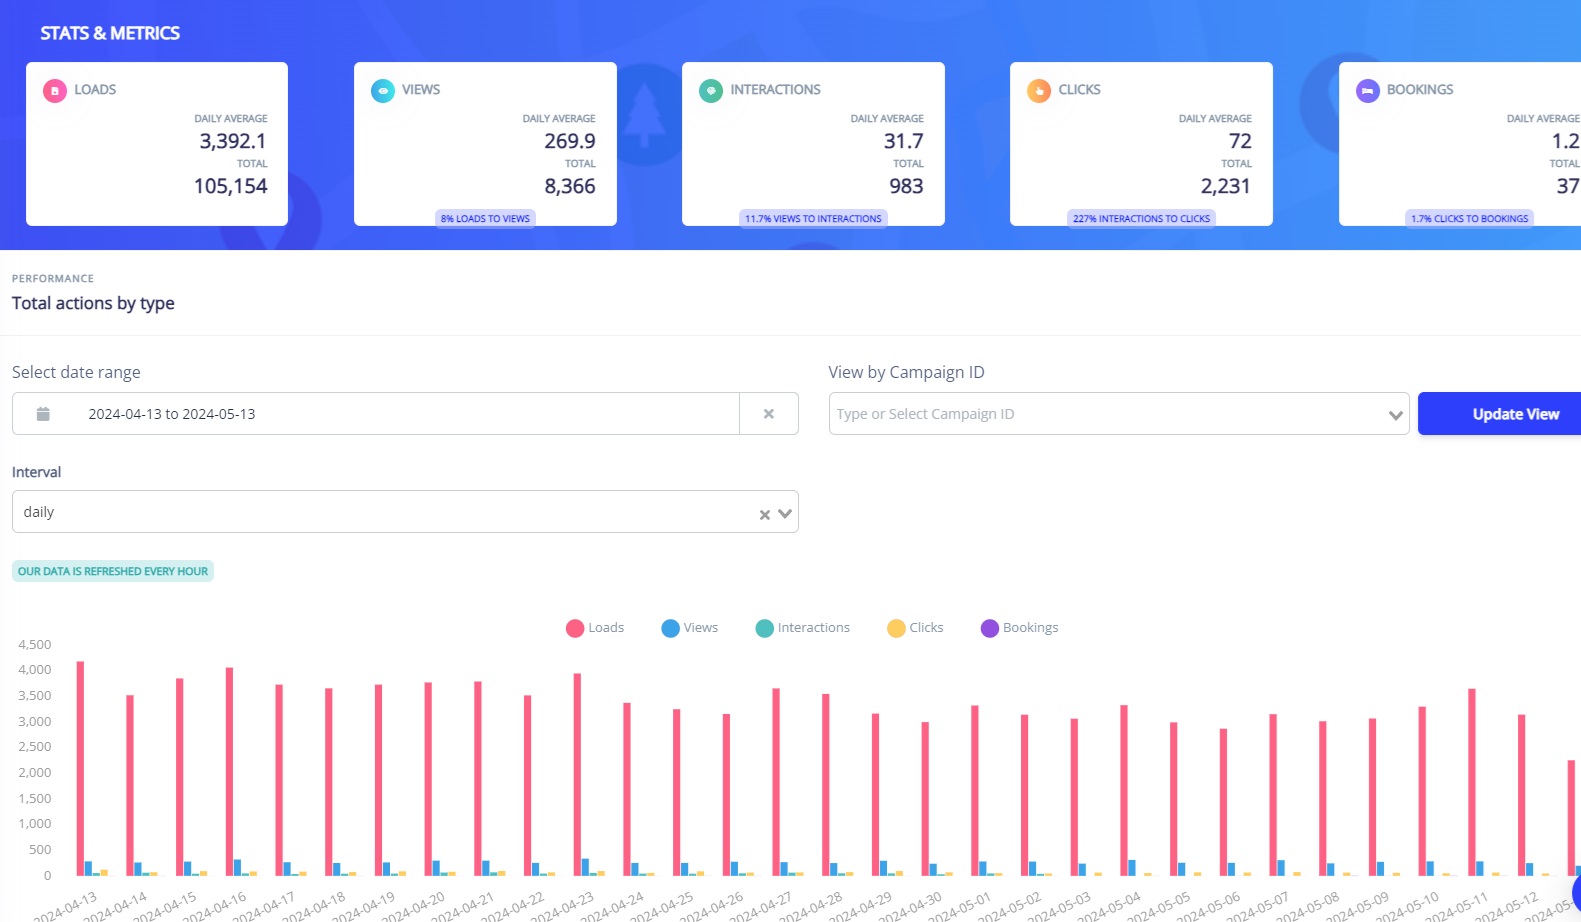
Analytics Tab

The Analytics tab takes a visual approach to showing your booking data, and, like the Bookings tab, can be adjusted for select date ranges.
Across the top in the Stats & Metrics column, you'll see five boxes focusing on Loads, Views, Interactions, Clicks, and Bookings.
Loads reflects the loading of all Stay22 products, be it maps or the LMA script. Views is a map-specific calculation of how many times a map was present in the visible window. Interactions is another map-related section only, illustrating how many times users engage with maps. Clicks and Bookings, on the other hand, are reflective of all Stay22 products, with the number of times a user has clicked out (Nova/POP excluded) and made a purchase (Nova/POP included).
Although this hierarchy is a little confusing as some only focus on maps and some include all products, it gives you an interesting breakdown of the sales funnel on your site.
Particularly of note are the Views and Interactions metrics as they focus on map data only. For those who have show maps globally but have a low percentage of Loads to Views, for example, you may realize that your map is located too far down the page and could be pushed higher to get more visibility and, subsequently, more clicks and bookings. Likewise, if your Interactions has a drop-off (say, < 10% views to interactions), you may want to test additional copy around your map to try and get users who see the product to engage with it more.
More views and/or more interactions often result in more clicks, and more clicks can potentially increase your sales!
- Note: As mentioned above, Clicks and Bookings data includes non-Map products on Stay22. As such, the calculation for Interactions to Clicks may look a bit confusing from what you are expecting. This is normal, but is worth keeping in mind as clicks are not 100% map specific.
Page Analytics Tab on Stay22

The Page Analytics tab on Stay22 was rolled out in mid-2024, and is all about sharing the page data where bookings were made on your sites.
First, to use this one, you have to make sure that your Domains are listed in the Company Information section of the Settings tab. This will attribute the Domains in the column appropriately, as without claimed domains, it will display an Unknown tag.
Once that is installed, you can get a glimpse of what page (by URL slug) bookings were made from over any given date range. You will also see Total Bookings, Total Clicks, an EPC calculation, and more.
This tab, over time, builds up historical booking data so you can identify what posts have the highest conversions and earnings rates. With this data in hand, you can look at top performing posts to try and identify why users are more inclined to make sales.
Is it from having prominent booking links? Being about a topic better suited for the sales funnel? Something else? When you can identify trends in booking data based on the type of content that is converting, you can repeat this in new and existing articles.
- Note: In this section, we're looking at trends. As such, you may want to let this tab collect data for a period of weeks or months before any repeatable trends are present. The screenshot above, for example, was taken just a few days after it became available. At one or two bookings per page, trends may not be present just yet. But once those become 10, 20, 100+ bookings, data analysis becomes far more insightful.
Overall, we are really loving the amount of data that Stay22 is providing on its analytics tabs for users. Whether you're simply wanting to get a quick look at your sales or do a deep dive in what is working, what isn't working, what could work better, and the like, the sky is really the limit on the number of points you can look at!
Do you have a metric you watch out for when measuring the success of affiliate sales like those on Stay22? Comment below to share!
Looking to get more out of Stay22? Be sure to download our Stay22 handbook (PDF) with everything you need to know about the network!
Join This Week in Blogging Today
Join This Week in Blogging to receive our newsletter with blogging news, expert tips and advice, product reviews, giveaways, and more. New editions each Tuesday!
Can't wait til Tuesday? Check out our Latest Edition here!

Increase your blog's revenue with Raptive!
Add premium display advertising on your blog with Raptive- accepting blogs starting at 25,000 pageviews per month! (Additional terms may apply.)
Upgrade Your Blog to Improve Performance


Check out more of our favorite blogging products and services we use to run our sites at the previous link!
How to Build a Better Blog
Looking for advice on how to improve your blog? We've got a number of articles around site optimization, SEO, and more that you may find valuable. Check out some of the following!