Published by Jeremy. Last Updated on April 15, 2024.
Disclaimer: This Week in Blogging uses demographic data, email opt-ins, and affiliate links to operate this site. Please review our Terms and Conditions and Privacy Policy.
Have you ever wondered how Instagram decides what Reels to place in the suggested feeds like Discover or Suggested for You? We certainly do!
After working on improving my Reels for my local blog, I started to see a bit of success where some posts would go nuts (being seen predominantly by Non-Followers) and others would perform along our historical average (and is seen mostly by Followers). So we decided to take a look at the data to see if we could find any trends as to why some would explode and others would not.
So in this one, we want to share a bit more of the analysis and some data points that we saw that were interesting.
A word of caution: We will talk about this more in our conclusion, but I suspect that the trends shown below will vary from creator to creator. One account may see a spike in Non-Follower views very quickly. Others may require more than what we saw. I will not be surprised if my own performance, for the very same account analyzed here, will change as it grows. We will discuss this more later on.
Methodology Used for This Test
For this test, we wanted to see if we could extract any trends on how Instagram Reels start to go crazy with views from non-followers. Is there a pattern? Are there any repeatable lessons learned? Is it good for growth?
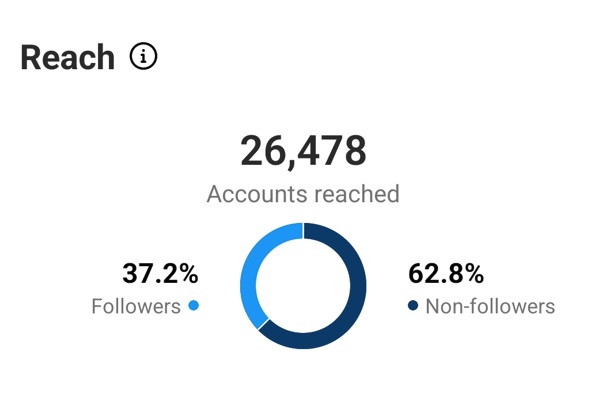
So we went to the analytics section for Reels to see what data we could pull out. We found a few data points that we found fascinating. There is the Total Play count, of course, but on mobile, Instagram also shows you data points like Accounts Reached broken up into a split of Followers and Non-Followers and a Profile Activity section that includes Follows generated by the Reel.
This data is fascinating as we can see the total views, but also the split between non-connected users and our subsequent followers for each video. While we can't tell where the non-followers saw our content (shared from friends, Explore tab, Suggested for You feeds), we were curious if any trends were present all the same.
Before diving into the results, we have a few issues here that may influence the data and this analysis as a whole:
- The performance data tracked about 30 videos from a single account over the course of a year. The account size ranged from an estimated 27,000 followers to 35,600 followers over that time.
- Boosted Reels seemed to lose access to the Follower vs Non-Followers split. For some unknown reason, my analytics dashboard is different on these, and I cannot seem to get that breakout back no matter what I try. So a couple of my extremely high-performing posts (including one that had 600,000+ views with 5,000 new followers) could not be used here.
- Side note: Boosting Reels was an absolute waste of money in my opinion. My average performance was 120-300 plays per $1 spent. Interestingly enough, I did see a data point of followers gained from each ad, and my average spend was $1.33 per new follower. Ouch!
- Finally, while I know that my content does appear in places like the Explore and Suggested for You feeds (I've been told as such), I did not do spot checks when our Reels were gaining views to confirm one way or another on a Reel-to-Reel level.
When Do Non-Followers Start to See Our Content?
The first question we had was wondering when Non-Followers start to see our content on any appreciable scale. Some posts always seemed pretty heavy for our existing Followers, and then there always seemed to be some unknown point where Non-Followers started to explode. So, what is the relationship?
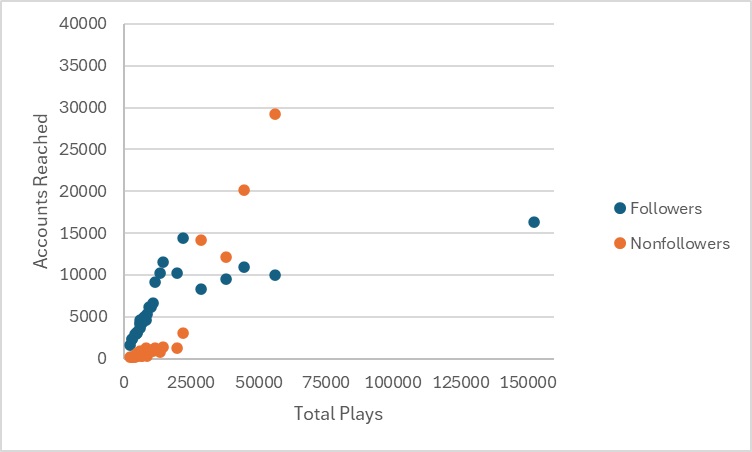
We decided to plot data points from our Reels to see if a trend emerged. The graph was constructed with Total Plays on the x-axis, Accounts Reached on the y-axis, with two sets of data displaying the split of accounts of Followers (blue) vs Non-Followers (orange). This is what that emerged:
Now this is interesting!
For discussion purposes, there are three bands of data that I think are worth highlighting here.
First, and perhaps the most hard to see, is videos < 5,000 plays. These are “average” videos for us. Good, but nothing really happened outside of normal performance. Virtually all of the accounts reached here were Followers. Some Non-Followers saw this content, but on average, it trended to be a 90/10 split (if not more) towards Followers. This seems fair, logical, and suggests these videos were not placed in any Suggested for You feeds.
Second, as we reached 5,000 to 20,000 video plays, what we'd call “pretty good” video performance, the split slowly started to change. Nothing too crazy yet, but we often see upwards of 10-20% of accounts reached being Non-Followers. On average, I'd say we were at about an 85/15 split here. Is this the algorithm putting us into suggested feeds or simply a function of shares? We're not so sure.
Finally, it wasn't until we started trending well over 20,000 video plays that the split really changed dramatically. We would see 40%, 50%, and in some cases 90%+ Non-Followers reached as a Reel became more and more viral. At some point around this mark I would hazard a guess that oure videos were absolutely being placed into Suggested for You feeds, but at most we can say is that a shift in views happened at some point.
Admittedly, this was also bound to happen. Our account was somewhere between 27,000-35,000 Followers during the year, so, naturally, any views above a certain level had to shift dramatically to Non-Followers. This appeared to happen at around 10,000 Followers reached (28-38% of our total account size). Is this the max users we can reach at any given time (say, active accounts that follow us)? We're not sure. We had some jump close to 20,000, especially at the higher end of the total play scale, but we'll just settle with this one as an overall maybe.
I'm hesitant on drawing any conclusions from this data set alone, but it does seem to suggest that once my videos hit 10,000 Followers reached (or 20,000 plays), there may be some trigger that causes Non-Followers to see our content more- either via shares or being picked up in those prized Suggested for You feeds.
Plot yours and see if you have a trend!
Do Engagements Matter?
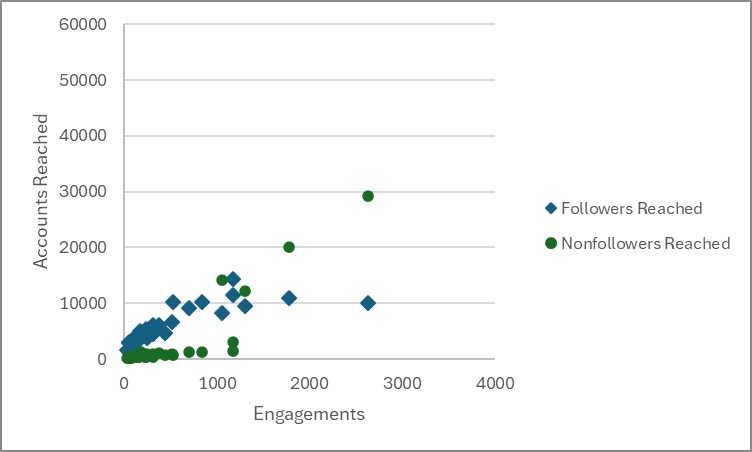
The next set of data I wanted to look at was to see if total engagements (sum of likes, comments, shares, and saves) had any potential impact on how Non-Followers are reached. So in this one, we plotted total engagements on the x-axis, accounts reached on the y-axis, and the breakout of Followers (blue) and Non-Followers (green) on the graph. This is what emerged:
Much like in the previous graph, you can see how our Followers reach has an upper limit. With few exceptions, our account has trouble reaching more than about 10,000 to, at most, 15,000 of our actual Followers.
But at some point between 1,000 to 1,200 total engagements, something interesting happens- our Non-Followers reach spikes. The curve switches from being flat to a rather dramatic rise with a much steeper slope. I plotted these individually for Likes, Comments, Shares, and Saves, and while Shares had a bit of a trend that I could talk about more, it was not nearly as pronounced as this one.
The total engagement rate for where this particular curve jumps is around 3.5%-5%, depending on the account size at any given time. Is there some magic figure where if you reach a specific percentage of engagement that external algorithms start picking up to jumpstart your Non-Follower reach? It may be a stretch here with this limited sampling, but I think there may be.
That said, I also think there is an inherent risk with this data set in that this data is still specific to my account and may not be representative of others. I'll talk about this more later on, but suffice it to say the most I can offer here is the same as in the previous point- plot your data and see if you have a trend.
Are Non-Followers the Best Audience to Reach?
The next question I had with this was more about who these Non-Followers are to begin with. My Instagram is designed around my destination blog, so I really only ever want my content to target people who live nearby or have the potential to visit. I've heard some horror stories about viral Reels bringing in some non-ideal Followers for some (e.g. people from halfway around the world who are very unlikely to ever visit and/or support a partnered business), so I was genuinely curious about how good the algorithm is when recommending content to those who have little connection to our page.
Admittedly, Instagram doesn't show the demographic split here, and I would need to pick up a ton of followers from Reels to get any statistically significant change to my current demographics. I'm not there yet, so this is all speculation at large.
That said, the last data points I looked at were how many Follows my Reels generated, and I compared them as a function of the total Non-Followers who were served my Reels. This ranged from as low as 0 follows on 959 Non-Followers reached to as high as 717 follows on a video with 96,848 Non-Followers reached.
It wasn't until we looked at the percentages that things started to show a trend- 0% to a max of 1.15% of Non-Follower views turned into followers. The average was a scant 0.58%. This means that, on average, to grow my Instagram profile by 1,000 Followers via Reels, my videos would need to be viewed by approximately 175,000 Non-Followers. Ouch.
Honestly, that conversion rate is terrible. I expected something low, but was thinking it would be on the order of 1-3%, not a fraction of a percent with only two videos being outliers that broke 1% at all (and even then, just barely).
- Note: My biggest Reel, whose data I cannot access as I had previously boosted it, had 600,000+ views. Obviously, based on my account size, this means that the split of Followers to Non-Followers was at least 5/95, if not pushing to 2/98 (my estimate). But even this one, I only picked up 4,966 followers. So if we are cautious and say 95% is the split here, this, too, clocked in at a conversion rate of 0.8%.
The big question here, to me at least, is not so much about the 0.5% who decide to Follow. Without looking at demographic data, the most I can really do is look at profiles in a spot check, and while I am fortunate enough that most seem to be regional and could be interested in my content, it is also hard to say on a significant amount, too.
This leads me back to the other 99.5% who saw my content, perhaps even engaged (liked), but didn't follow. Who are they? Are they the right audience? Will they ever visit my city? Will they support local businesses? If a brand is paying me for reach and a Reel goes viral, is it actually worth it? These are the issues I think about with the suggested feeds, and for creators outside of a broad entertainment spectrum, this could be an issue. But, much like everything else, I have to admit that we really just don't know!
What is Going On With the Suggested Feed?
When it comes down to it, even after looking at this data, I cannot draw any firm conclusions. But I have some theories based on what I'm seeing.
First, all of my Instagram Reels had a split of Followers and Non-Followers seeing them, even with “average” performance. I suspect that, at the start at least, most Non-Followers who see my post found it in the conventional use of social media. That is to say, a follower of ours liked our Reel, shared it, their followers saw it, the process repeats, and so on. This is how other algorithms work, like shares on Facebook, but doesn't explain the Suggested feeds model outright.
Second, at some point, which in my opinion really does appear to be around 20,000 plays or 1,000 engaged for my account, the algorithm starts to take over in some capacity. My videos start appearing in curated feeds like the Explore tab, Suggested for You placements, etc. Who sees this, where do they live, what metric triggered it for them, well, these are truly unknown. In this instance, all I can say is that it looks like some unknown mechanism is triggering a rapid rise in views, and friends, family, and friends-of-friends sharing does not seem to explain it alone. Possible? Sure. But also unlikely.
Third, I have spoken to other creators who have seen similar trends, but their data points do not line up in the same spots both in absolute terms or in percentages. Some immediately get put into a Suggested for You feed with crazy Non-Follower views at the start while having very low Followers views no matter what they do. Others are like mine with a clear shift. Others have never had a jump happen at all.
Because of this, I don't think there is a one-size-fits-all number that determines whether you get placed in the Suggested feeds. I suspect that each account has a point where above-average performance would be noticed by the algorithm. Is it based on percent reach? Total plays? Percent engagement? All of these? Clearly, something is happening for me as shown in the data, but I suspect everyone's accounts could be different. There are simply far too many variables at play to isolate one factor here.
Fourth, as a tangent of the previous point, I think the algorithm works somewhat unfavorably here to benefit already popular accounts. Even on my own end, it seems like the point where I start to break out with Non-Followers is becoming easier with each passing post. Is it because I am hitting this mythical benchmark easier? Because I recently changed my style to be more appealing? Or is it because the algorithm is simply starting to favor my account and making it easier as time passes?
The answer to all of these very well could be yes.
This could be one possible explanation for why accounts seem to blow up seemingly overnight. They figure out a style that works for their audience, and the algorithm notices. They do it again, the algorithm notices even more. Repeat a few more times in rapid succession and then, all of a sudden, their feed is always recommended.
Suffice it to say, in another year, I would not be surprised if I plot the same data and find the curve shifts to the left significantly.
Finally, I would be remiss if I didn't mention that the way algorithms work on social media has changed. Yes, you can still reach your followers, but the push for Suggested feeds has made the networks less about reaching your current followers and more about reaching anyone with a shared interest (through unknown, algorithmic mechanisms).
Ultimately, these apps are products of businesses, and their definition of “good content” does not line up with ours as creators. Good content these days is not what we personally want to see, but rather whatever triggers engagement. Engagement means more app use. More app use means more revenue for the bottom line. We can complain about terrible reach and poor algorithms all we want, but this is likely one explanation why Reels and other short form videos all seem to be standardizing around common themes, trends, memes, and the like. They work!
Do you have to produce engagement-bait to get shown into the Suggested feeds? Not necessarily. But you do have to produce engaging content all the same, or else you may never trigger the mythical floor I have been seeing in the above analysis for growth. How you can balance that for the types of content you like to produce, well, that is on you.
At the end of the day, this data was a fascinating glimpse at when my content starts to explode on Instagram's Suggested Feeds, particularly for Reels. It does feel like some of this is a bit of a “which came first” analysis as I could make arguments of cause and effect in either direction. Throw in that everyone's data will likely have a different point when they shift, it feels like we are all chasing a moving target.
Still, plot your data and see if you have any trends emerge that you can use as a guide!
Do you have any ideas when your Reels start getting promoted in Suggested Feeds? Perhaps from plotting data like the above? Comment below to share!
Join This Week in Blogging Today
Join This Week in Blogging to receive our newsletter with blogging news, expert tips and advice, product reviews, giveaways, and more. New editions each Tuesday!
Can't wait til Tuesday? Check out our Latest Edition here!
Upgrade Your Blog to Improve Performance
Check out more of our favorite blogging products and services we use to run our sites at the previous link!
How to Build a Better Blog
Looking for advice on how to improve your blog? We've got a number of articles around site optimization, SEO, and more that you may find valuable. Check out some of the following!






Thanks for sharing nice info, keep up the good work