Published by Jeremy. Last Updated on September 25, 2023.
Disclaimer: This Week in Blogging uses demographic data, email opt-ins, and affiliate links to operate this site. Please review our Terms and Conditions and Privacy Policy.
Google is fickle when it comes to providing information that can be helpful for publishers. They rarely publish SEO guidelines and are equally silent on algorithm changes overall apart from self-serving tweets from a few key employees.
One tool that Google does provide that website operators can use is PageSpeed Insights. This service is designed to score your site on a 100 point scale which is somewhat analogous to site speed. The higher your score, the “faster” your site is as perceived by Google. Whether this score itself is an SEO factor remains to be seen, but many experts would say that the technical components that go into the score most certainly are. But if we were to ignore this altogether, the simple truth is that if Google shares tools that can help publishers, you'll do well to at least look into it more.
In this guide, we wanted to breakdown how we look at PageSpeed Insights, and highlight several ways you may be able to improve your PSI score as well.
How to Check Your Google PSI Scores
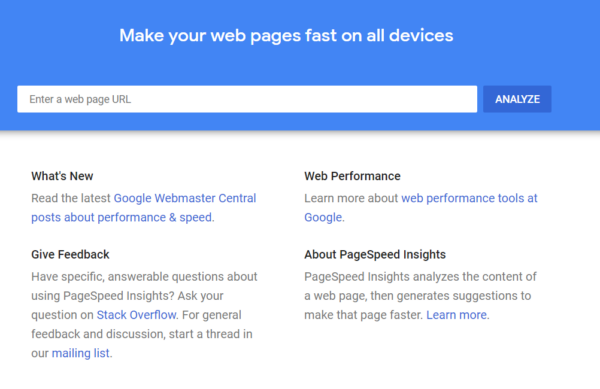
Checking your Google PageSpeed Insights score is simple. All you have to do is head to the tool, and type in any link you wish to evaluate. We like to look at our scores for our homepage as well as individual articles and always recommend checking how global changes affect your scores on both.
After the tool is done running, you can toggle between desktop and mobile breakdowns in the menu just below the URL box. Like checking how your score changes on individual articles and on your homepage, you'll do well to check the breakdowns between desktop and mobile- especially considering Google's increasing prioritization of mobile search results.
The first thing you'll see is a score on the 100 point scale, with anything above 90 considered to be “good”.
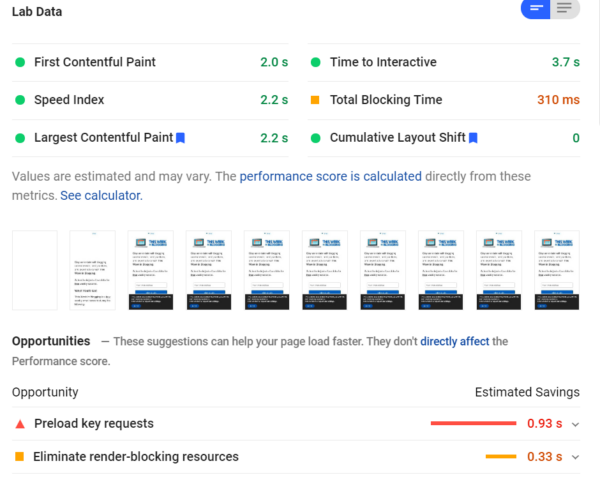
From here, Google provides an array of data points, often color-coded in the same fashion as the top-line score, and gives you brief (but not always simple) breakdowns of your metrics. Some of these may be quick numbers and no context- such as under the “Discover What Users Are Experiencing” header (meaning you may need to read more to find out what they mean, formerly “Lab Data”). Others, especially those under the “Diagnose Performance Issues” header, when expanded at least, give a bit more detail as to why your site may be slow including pointing to specific scripts, images, or files that are pulling your site down.
Here, you may need to look for some cues to determine what is causing actual speed issues and should be prioritized. Generally speaking, if something under the “Diagnose Performance Issues” header is showing as taking > 1 second of load time, you may want to try and understand why that is. Likewise, the same is true for any file larger than a few hundred kilobytes in size (especially those that exceed 1 MB). Sites that score in the 90s generally load in 1-2 seconds and are well under 1 MB in file size, so these could be good indicators where you can dive down more for speed improvements.
Unfortunately, many of these recommendations are going to be highly site-specific such that it is hard to speak beyond the general sense above. That being said, the following are a few categories where we routinely see blogs struggle with regards to site speed and PSI scores. These may not fix your site's problems specifically, but they are things you may want to check all the same (and remember, you should check your scores for your homepage, articles, and on desktop/mobile for each test run!).
Defer Ads if You Are Able
If you run programmatic advertising on your site (like Adsense, Ezoic, Monumetric, or Mediavine), you are inherently going to have a bit of load that will greatly impact your PSI scores. The reason for this is because they are fairly javascript heavy and require a bit of time to send data out to the ad servers, wait for a bid, and return each and every ad.
For everyone on networks like these, it will be worthwhile to look and see if your network offers a feature to defer ads until the user interacts with your page. This is essentially a lazy load function (which we'll get more onto later) but is something that has to be done on the ad provider's side as most lazy load services that exist cant account for the ad servers properly the way they can static images.
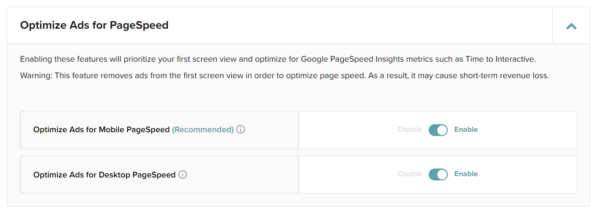
Mediavine, for example, has implemented this as an offered feature called “Optimize Ads for Mobile Page Speed” and “Optimize Ads for Desktop Page Speed” and is a one-click turn on that will not show your ads until a user clicks or scrolls on your page. By using this, many bloggers have seen an immediate improvement in PSI scores (often double digits or more) simply from deferring ads for a brief moment. This offering varies from network to network and maybe named differently if it is available.
As for revenue? Well, ad networks typically do note that deferring ads may cause a drop in revenue, but in practice this is only visible to those who display ads above the fold as they may have decreased views resulting from the slight delay. Below the fold ads, in our experience at least, remained unchanged.
In any case, showing ads on your site can cause a significant slowdown to your page (some networks more than others), and is a tradeoff we often accept as a means to monetize. That being said, if your network has an opportunity to effectively defer/lazy load ads, you may do well to look into it!
Reduce Plugins to Minimize Javascript Files
One of the reasons we love running our sites on WordPress is the access to many amazing plugins that we can use to customize our sites. Unfortunately, not all plugins are created equally and some are resource-heavy and, in a word, slow.
Many bloggers can benefit by performing a plugin audit and determining which plugins are putting a burden on their sites. The PageSpeed Insights tool will make suggestions on what scripts are large file size, and if the name extension of those coincides with a plugin you are running, it could be a sign that a change is needed.
Thankfully, there are so many plugins that exist that odds are good a lighter, faster version exists that could replace a sluggish option you have on your site (Jetpack, for example, has a reputation for being notoriously slow). As mentioned several times in this article already, this is something that could vary from site to site such that we cannot make specific recommendations for exact issues outright. But, we do recommend checking out our guide to WordPress plugins if you are in need of alternatives to popular applications that are light and fast!
- Some javascript issues may be theme-related over being due to a plugin. This is because some themes come with all of their functions turned on out of the box independent of if you use them. We like GeneratePress purely because you can turn on and off what functions you wish to use which helps greatly with site speed. Determining where the script comes from can be tricky, however.
Another recommendation that is common in PageSpeed Insights suggests combining and minimizing CSS and javascript files. This minimization process can be accomplished with the Autopimize plugin which combines files, compresses them, and offers savings as a result.
Sadly, depending on your theme, plugin array, and other settings the minimization process may not always work as intended (and some scripts, like your ad network, may need to be manually excluded). As such, when you get into this territory you could inadvertently break your site and require restoring an old backup, having to disable plugins, and other troubleshooting.
We recommend only pursuing this improvement if you're on a Managed WordPress server where they can assist you should any issues arise.
Optimize and Lazy Load Images
Another issue we've seen occur frequently on blogs is that images are not optimized, and it only takes a few multi-megabyte images to really destroy your load times- even for those on fast servers or, for users, ISPs. A lot of times this simply happened because we all started our sites without knowing about image optimization services and never took the time to go work through our catalog to fix it.
Thankfully, if images are your problem this one can be an easy fix.
The first thing we recommend everyone do is to install a Lazy Load plugin. Like the defer function mentioned above with ads, Lazy Load essentially holds loading an image until a user scrolls down the page close to that image. This allows the rest of your page to load upfront, and your server only has to worry about images when needed.
For these, a free version we like is Lazy Load by WP Rocket. We use the premium WP Rocket plugin for its caching services of which Lazy Load is a part of as well (many sites have caching issues as illustrated in the PSI tool, too!). Some image optimization plugins also include Lazy Load as a function, and WordPress 5.5 is said to include this by default and could potentially reduce the need for a Lazy Load plugin outright. (As of publishing, we have not updated to 5.5 yet as we generally wait a few weeks for bugs to be found and fixed. We will update accordingly after installing the latest edition.)
- One caveat in this section is that Lazy Load only works on images below the fold. That is to say, below the first screen view. Any image you have visible on your site above the fold will be loaded upfront and, if not optimized, can contribute considerable load onto your site. This is one of the reasons why I often go for a minimal aesthetic above the fold- images here can really reduce your speed!
But on its own, Lazy Load does not do anything to minimize the file size. It only defers the image outright. If your image is quite large in file size, it could still take quite some time to load as users scroll (and if it is sufficiently large, several megabytes, may not load until a user is past it). This is why optimizing images is also important.
We personally use the free plugin Smush which optimizes images up to 1 MB in file size at upload. We do this in combination with exporting images in Lightroom to reduce their file size to < 1 MB to allow for the free compression (this also helps minimize server usage overall). For those who have uploaded a number of > 1 MB images to your server, a license for Smush Pro will allow for compression of images up to 32 MB in size and also allows for bulk optimization of existing images on your server. For the price, it is a great value.
Upgrade Your Host
One of the more common line items seen on PageSpeed Insights is simply “Reduce Server Response Time”. This time is often considered to be how much it takes for the request to hit your server and the first piece of data to come back.
The best servers we've seen can do this in about 0.2 seconds, and often when paired with a CDN can do this anywhere in the world. Slower servers, well, we've seen 2+ seconds just to get the first bit of data back.
If your server response time is trending north of 1 second, and you have some money to invest, upgrading your host can do wonders to your score and speed overall. We use BigScoots, and routinely have server response times on the order of 0.25 to 0.3 seconds (although, your mileage may vary). While there may be some theme and/or plugin components that could impact this speed, we'd bet it is most likely host related.
Check Other Services Like GTMetrix and WebPageTest
One of the things I don't like on the PageSpeed Insights dashboard is that broad categories like “efficiently encode images” or “remove unused javascript” show estimated time savings if you improve everything, but the individual line items only show the estimated file size improvement in kilobytes.
Here, file size is often not directly analogous to time savings.
Is it worth it to optimize one image, save 5 kb, and receive a potential time savings of 0.15 seconds? Why does serving images in a next-gen format offer 350 kbs savings and a 1.65 second improvement? Here, it is often hard to think about what is best to prioritize.
This is why I often pair this tool with other 3rd party services like WebPageTest and GTMetrix (check out our WebPageTest guide for how to use it. GTMetrix operates as a bit of a hybrid of PageSpeed Insights and WebPageTest). The reason I like these services is that they provide more detailed information that will help you drill down to the exact problem, although you may have to use all three in tandem to really isolate any specific issue.
One feature I love about these services is that they offer load waterfalls which display how each component of your site loads over time. GTMetrix even offers up links to web-optimized images for each file that needs improvements (great for sidebar or banner images) that you can download and use in a click. These are all different ways to look at the same problem, and what you may glean from these could ultimately tie back into your PageSpeed Insights score.
So if you are staring at the results on PageSpeed Insights and wondering what to do next, you're not alone here. It only goes so far in isolating the problems your site faces. One of these alternative services may help shine a light on the problem!
Did you improve your speed scores via one of these services? Comment below to share what you did!
Looking to improve your CLS scores? Click the previous link to check out some of our recommendations!
Join This Week in Blogging Today
Join This Week in Blogging to receive our newsletter with blogging news, expert tips and advice, product reviews, giveaways, and more. New editions each Tuesday!
Can't wait til Tuesday? Check out our Latest Edition here!
Upgrade Your Blog to Improve Performance
Check out more of our favorite blogging products and services we use to run our sites at the previous link!
How to Build a Better Blog
Looking for advice on how to improve your blog? We've got a number of articles around site optimization, SEO, and more that you may find valuable. Check out some of the following!


