Published by Jeremy. Last Updated on May 11, 2021.
Disclaimer: This Week in Blogging uses demographic data, email opt-ins, and affiliate links to operate this site. Please review our Terms and Conditions and Privacy Policy.
It is never boring running a blog as major players in the field can and do change the rules regularly- often without any advanced notice at all.
Sometimes we do get a bit of a heads up that change is coming, and Google's announcement that Core Web Vitals metrics would become a ranking factor has been known for quite some time. But in true fashion, many of us waited until the absolute last minute to start looking into it, and the time to do these improvements is now.
So in this one, we wanted to break down a bit about what Core Web Vitals are, what each metric evaluates, and give some tips on what to look for when improving scores on your own blogs!
Core Web Vitals Are Now a Ranking Factor

At its core, the biggest reason why any webmaster should care about Core Web Vitals (CWV) is that Google said it is going to be a ranking factor from June 2021 onward. It really is as simple as that. They say jump, we jump. They say improve Core Web Vitals, we improve Core Web Vitals.
We can argue whether the elements that make up CWV are actually important to the user experience and having a fast site. But really it comes down to the fact that Google says they're important (especially on mobile), so anyone chasing search traffic must treat them as important by extension.
The four biggest components of Core Web Vitals are as follows, and Google is prioritizing performance on mobile devices to start:
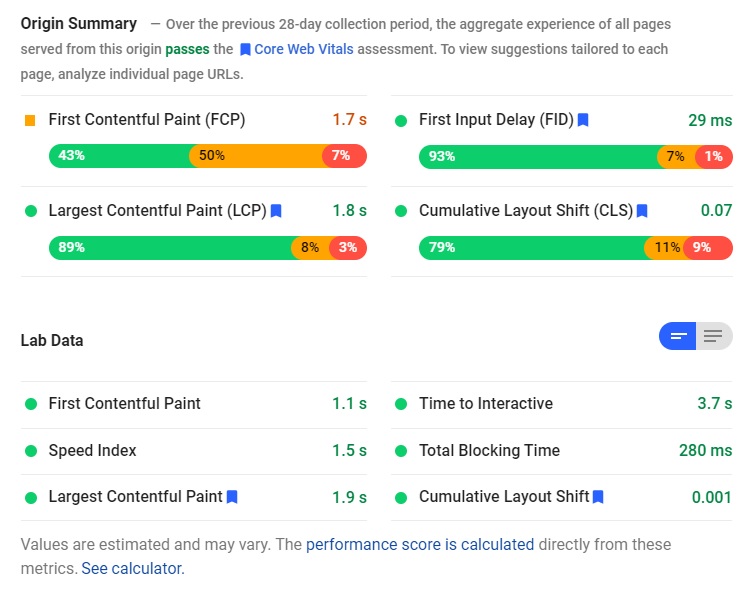
- First Contentful Paint (FCP) – How long it takes the first visual element on your page (above the fold) to display. Fast is < 1.0 seconds.
- Largest Contentful Paint (LCP) – How long it takes the largest visual element on your page (above the fold) to display. Fast is < 2.5 seconds.
- First Input Delay (FID) – How long it takes your site to respond when a user first engages on it (i.e. clicking a link, navigation menu button, etc.). Fast is < 0.1 seconds.
- Cumulative Layout Shift (CLS) – How much time is associated with content shifting on your page during load. Fast is < 0.1 seconds.
Google summarizes FCP and LCP as loading performance as it is a measure of how long your first and largest above the fold content takes to display respectively. They summarize FID as interactivity performance as it is a measure of how long your site takes to respond to engagement (i.e. how fast your site responds after a click). Finally, they summarize CLS as visual stability of your site as an unexpected movement of content is said to be poor for the user experience.
But as these are all reflections of the user experience of your site, Google has gone further than simply saying that you must pass these metrics based on how their crawling bots see our sites (that would be too easy). No, for Core Web Vitals they monitor actual user data and tabulate your score as an average across all users.
As we all know, users on a slow internet connection may see more pronounced oddities on websites than those on fast connections (like more pronounced CLS events, longer loads for large content like images, etc). This means that achieving passing scores across all users in all localities is that much harder than only for a bot on the fastest connections out there.
Thankfully, tools like PageSpeed Insights let us see spot-check performance data (under Lab Data) as well as average data across all users on popular articles with sufficient traffic (under Origin Summary). Generally, we think if we can get spot check data to be sufficiently passing in the above categories, then it is only a matter of time (days or weeks) for the average performance data to catch up.
This, obviously, is not guaranteed, but is a good way to think about things while waiting for average site performance data to come in.
So, what are some things to think about for each of the CWV categories? Let's break them down further.
- Many bloggers have found that their mobile performance improves faster than desktop after improvements are made if only because we typically receive far more traffic on mobile. So don't be surprised if your desktop averages take a long time to improve compared to mobile scores in the Origin Summary / Search Console breakdowns.
First Contentful Paint and Largest Contentful Paint

When it comes down to it, we can think of FCP and LCP as two sides of the same coin. As explained above, FCP is the amount of time it takes the very first visual element of your site to display and LCP is the amount of time it takes the largest element above the fold to display. We can discuss these together for simplicity.
A lot goes into how these speeds are determined but both generally appear to be calculated starting when your site initially loads.
So, not only are you worried about the file sizes of the items that load first (be it text or, more importantly, a logo or header image) but also the performance of your server, theme, and plugin array overall as these all can go into how fast your site initially loads too.
To give an example, if you have a fast theme and fast plugin array, but are running a basic server with a Time to First Byte north of 2.5 seconds, you are not going to in any way, shape, or form pass an FCP of < 1 second and LCP of < 2.5 seconds no matter how well you've optimized your site. Your server would simply be a limiting factor.
But if you are on a premium server and have a Time to First byte of 0.2 to 0.5 seconds (what we get with BigScoots), then you may need to ensure that you have no theme or plugin settings causing rendering issues and/or optimize your above the fold content to be low in file size (especially important for images).
You can imagine that if your server takes 0.5 seconds to respond and you need the first piece of content displayed in < 1.0 seconds, that you don't have a lot of time for other scripts or files to eat into that. This is why we say all factors that go into how your site initially loads matters- you really don't have a lot of time to lose in any respect.
When looking to improve your LCP and FCP, you can use some of the following to evaluate your site:
- The element that makes up your LCP can be easily identified in WebPageTest reports (click the LCP link in the main table after running an evaluation on a specific page).
- You can also look at the Filmstrip View at up to 60 FPS speed (the Filmstrip View link listed to the right of any Run Report) and try and see if you can identify the very first visual element to load to target your FCP. Sometimes multiple elements load in unison, especially on faster sites, which makes this one harder to determine. If this is the case, it would be reasonable to assume it is the first element at the top of the page.
- LCP and FCP times are often shown in the load waterfalls on services like WebPageTest and GTMetrix as well. While they may not highlight the element that is LCP or FCP specifically in these, you may be able to look at all of the elements that load prior to that (javascript, css, images, etc) and see if one specific one has a large contributing factor to time that could be blocking content load outright.
Overall, there is no easy answer as to what you must do to improve FCP and LCP because there are sadly too many site-specific factors that go your specific load times. But using the above logic could help you identify possible FCP and LCP elements.
- LCP Workaround: One thing I personally did to get around an image or my logo being my LCP was simply increasing the H1 text font size (article titles) such that they became the largest element to load above the fold on both desktop and mobile. As my font file loads faster than image files, it helped shave the LCP time dramatically.
First Input Delay

Out of all of the Core Web Vitals, First Input Delay (FID) is probably the hardest to diagnose. Part of this is because it is based on how fast your site responds to the first interaction (a click, typing in a search box, etc.) and also because a good score is < 0.1 seconds.
To translate, Google wants your site to respond almost immediately when a user engages with it. Delays of any kind here may impact the user experience, which is why they are prioritizing the speed being so fast it is virtually indistinguishable to users.
A good example of something that could be a FID event is if someone clicks a drop-down menu while the page is loading. In a perfect world, your site would respond in < 0.1 seconds to achieve a “good” score (that is to say, responds immediately). But in practice, you may have a script or other files loading in the background that prevents interaction on your site somehow.
It could be something render-blocking. It could be something simply consuming all of the user's resources/bandwidth. It could be an inherent flaw in your theme or caching setup. It could be something else altogether. The sky really is the limit.
The first step would be to identify that you have a problem in PageSpeed Insights. The second would be to try and see if you can replicate a delay in any capacity via testing. If you can see a noticeable lag when typing into a search box or clicking a navigation menu, you may be able to correlate that to what is being loaded around that same time.
- Sometimes scripts that block other files from loading can be visible in load waterfalls like on WebPageTest. If you see one file that has a large load time (horizontal band) and other files that do not start loading until after that one has finished, it could be a possible culprit. Many FID issues we've seen occur when a site is functionally loaded but some backend script is taking far too long to load and blocks everything else.
In a perfect world, most files on your site should load independently of each other and, of course, quickly. This should allow for all aspects of your site to respond immediately if/when a user tries to engage on it (hence FID as a category). When one of these is out of sync and causing a delay, this would be the first kind of diagnostic we'd look at.
How you fix it, well, that is where the fun begins as it could simply be a setting that needs to be changed in a caching plugin like WP Rocket Pro (great for speed), swapping a slow plugin to a faster one (or one that is compatible with other plugins you use- check out our favorite WordPress plugins here), changing theme settings, or changing your theme outright (GeneratePress rocks for this stuff)!
Another perk of WordPress being an open source content management system- there are no easy solutions!
Cumulative Layout Shift

Finally, we end on Cumulative Layout Shift (CLS)- the category that is the bane of most web developers' existence.
Google calls CLS a “visual stability” metric as it is all about how much content moves on your page during load. But this is not covering all moving content but rather only the content that is moving unexpectedly from the perspective of a user. Emphasis should be on the phrase “layout shift” as the quite literal interpretation of this is what we're talking about.
The simplest explanation is that Google likes static content.
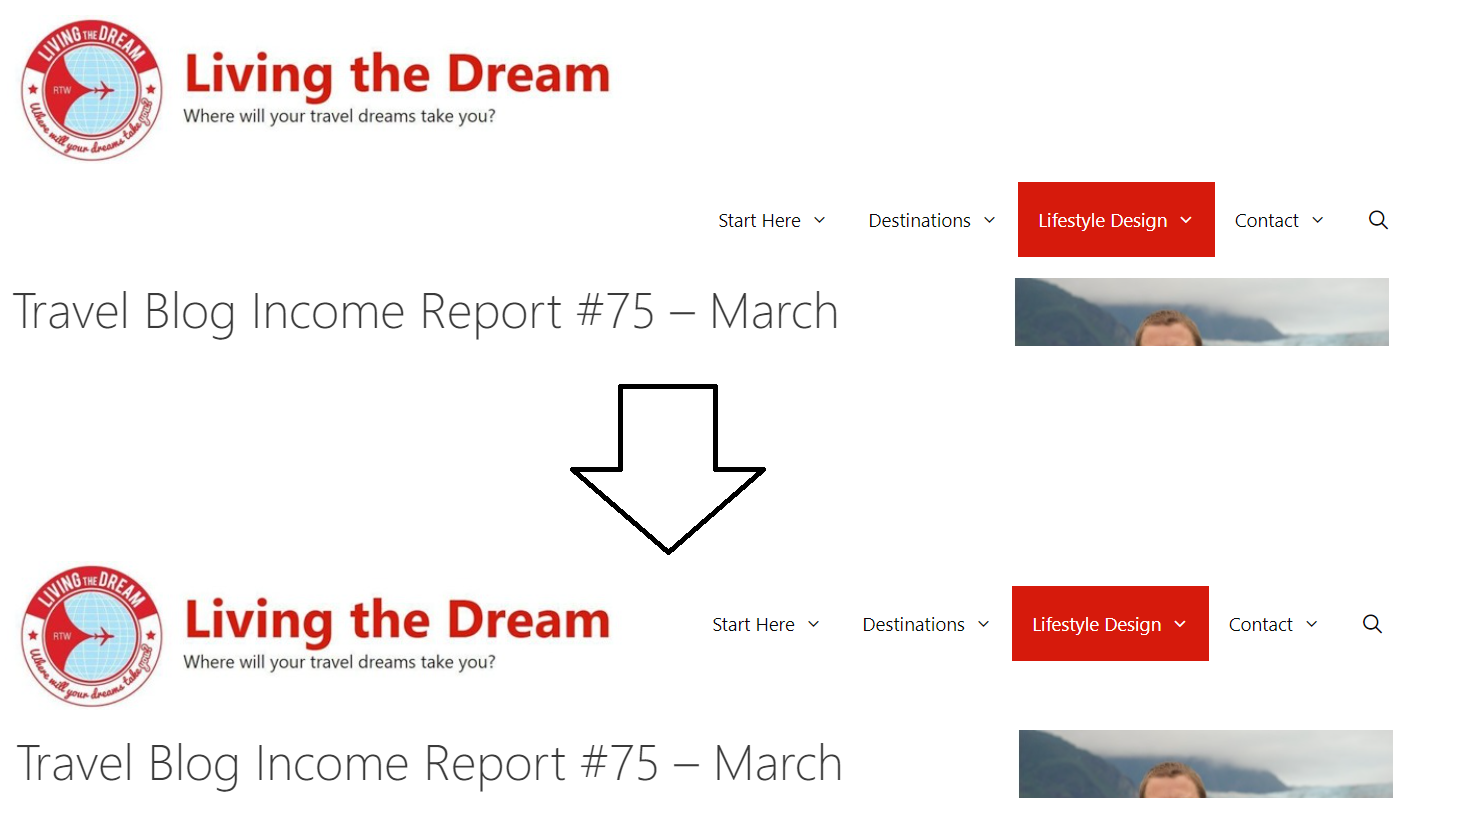
A more drawn-out explanation is that they want static content to load (and remain) in the exact spot where it is coded to be. If your logo is in the top left and your navigation menu is in the top right, they want both to load in exactly those places. If your logo is delayed in loading, and your navigation menu first loads in the top left and then shifts to the top right when the logo gets delivered, that is a layout shift.
These sudden movements occur for a number of reasons, often when elements (like content boxes or images) do not have proper dimensions defined, and diagnosing the movement can be infuriating because Google wants the total shift time to be < 0.1 seconds- much like FID, this means essentially no movement.
A few things you can watch out for are the following:
- When you load a page, watch for any content that gets shifted upon loading. Whatever the element is that comes in later that triggers the original content to move needs to be addressed in some capacity. You may need to reload your desktop and mobile site multiple times to see shifts- especially when you're trying to shave off a few 1/100ths of a second as it is quite difficult to catch these movements.
- Load waterfalls like on WebPageTest (Filmstrip View at 60 FPS) can help catch some elements that you may not otherwise see in real-time testing.
We've written an entire article on novel ways you can improve Cumulative Layout Shift on your site, and we highly recommend checking that one out. But this also assumes you already have other premium services on your site like a compatible theme and caching style plugins like WP Rocket Pro enabled as well.
It is worth highlighting again that the Core Web Vitals metrics are based on the average times across all users. This includes those on fast connections (like most bloggers probably have) and the slowest of mobile connections. As such, some visual elements (especially large file size images) may cause a more pronounced shift for some that you simply cannot replicate on a fast connection at home- this is why evaluating with load waterfalls may help as well.
Overall, some Core Web Vital metrics are easier to evaluate and improve upon more than others. While we are unable to give specific recommendations which will apply to everyone (thanks to WordPress being such a unique CMS), we hope that the above thoughts may help you drill down and isolate what factors are contributing to negative scores on your own site!
Have you found a unique site feature causing an issue with your CWV scores? Comment below to share!
Looking for guides on how to use Webpagetest and PageSpeed Insights in greater detail? Click the previous links to check out our articles!
Join This Week in Blogging Today
Join This Week in Blogging to receive our newsletter with blogging news, expert tips and advice, product reviews, giveaways, and more. New editions each Tuesday!
Can't wait til Tuesday? Check out our Latest Edition here!

Upgrade Your Blog to Improve Performance


Check out more of our favorite blogging products and services we use to run our sites at the previous link!
How to Build a Better Blog
Looking for advice on how to improve your blog? We've got a number of articles around site optimization, SEO, and more that you may find valuable. Check out some of the following!